Flipdot Display
Like every other person out there, I spend a bunch of time on YouTube watching creators build cool stuff. Combined with the fact that I was moving houses and looking for home decor, a simple video on a flipdot display really caught my eye. I got caught up in the rabbit hole and found myself trying to build one (before realizing it was much more sensible to just buy the modules). I didn't have time to set it up right away, but this winter break gave me the perfect opportunity. After getting the hardware sorted, I set out to build some over the top sophisticated software for it and I’m honestly thrilled with how it turned out.
The template repo
First off, I wanted a hermetic toolchain and a multi-language build system, partly to learn, and partly cause I wanted a challenge. I chose Bazel because I’ve used it before and I actually kind of like it (alternative would be buck2). Next, I wanted to work from any computer with ease, so I set up Docker dev containers. The real problem was with ros2. Bazel doesnt natively work with Ros2 (it uses a different build system called colcon) so I used a rules_ros2 to bridge the gap. I figured I would reuse such a setup in other projects as well, so I spent some time setting up a template_repo. Its setup to be complete package, and includes the following features -
bazel autocomplete
hermetic cpp toolchain llvm
hermetic cpp linting and formatting
hermetic python and ruff linting + formatting
aliases to make everything easier to check and run
get the clangd vscode toolchain to work with bazel
renovate bot
runs ros2
Now, I can just clone it and have a full ROS2 + Bazel environment with autocomplete, linting, and a hermetic LLVM toolchain without installing a single thing on my host system. With the dev environment ready to go, it was finally time to look at the actual hardware.
Hardware
I bought the display from Alfazeta—a 28x14 grid (which internally had two 28x7 modules). I picked up a 6A power supply, which is total overkill since the two modules only pull 2A combined, but hey, it’ll be useful for the next project. The Alfazeta folks bundled a breakout board, so I wired that up to a Raspberry Pi running 64-bit Raspbian. After some debugging and cable-wrangling, I finally saw it pop up as /dev/serial0. Finally I checked if the display worked properly by using and modifying some example code from flippydot
The Roadmap/Features
After making sure the hardware actually worked, I sat down and defined exactly what I wanted this thing to do -
Pi-Powered: Fully controlled from a Raspberry Pi.
Modular Content: Easy to plug in time, weather, or text.
Laptop-First Dev: Develop without being tethered to the display.
Seamless Deployment: No manual "scp" chores.
Extensible & Efficient: A "low-fat" data structure that can scale if I add more modules.
Each of these features led to some specific design choices, and definitely cost me a few long nights, but it was all worth it. Let me walk you through how it actually went down.
ROS Integration
With 392 (28x14) individual dots to control, the first challenge was designing a ROS message that is both efficient and extensible. If I decide to double the size of the display later, the system shouldn't require a complete rewrite.
I defined a custom message, to handle the display data:
At first glance, it seems easy to send an array of 392 integers, where 0 is black and 1 is white. However, there is a catch in how computers store data:
The Wasteful Way: In ROS, the smallest unit we usually send in an array is a
uint8(1 byte). If we send one byte per dot, we use 392 bytes to represent 392 bits of information.The Efficient Way: Since a flipdot is binary (either ON or OFF), it only needs 1 bit of data. Because 1 byte contains 8 bits, we can "pack" eight dots into a single byte.
By packing the data i.e. send each bit in a byte corresponds to 1 pixel, we reduce the message size significantly:
Method
Data Size
Efficiency
One Byte Per Dot
392 Bytes
12.5%
Bit-Packed
49 Bytes
100%
By using this structure, I’ve reduced the network load by 8x. This ensures that even if I scale up to a massive wall of flipdots, the ROS network won't be bogged down by redundant data. The width and height fields ensure that the receiving node always knows exactly how to "unpack" those bytes back into a 2D image.
Visualizing
Once the ROS message structure was settled, I faced a practical problem: I didn't want to lug a heavy, clicking flipdot display to a coffee shop just to test a new font or a weather icon. I needed a way to "see" the display on my laptop.
My first attempt was a simple terminal-based visualizer. It would print out 0s and 1s (or characters like ● and ○) to represent the dots.
It was technically functional, but it was a nightmare to look at. It cluttered my logs, didn't scale well, and it was nearly impossible to judge the "feel" of an animation. I needed something graphical. Foxglove studio was a no brainer option, its a powerful visualization tool for robotics. My plan was to convert my FlipDotFrame into a standard ROS Image message and stream it to Foxglove.
However, I hit a massive wall with the existing rules_ros2 foxglove bridge. The bridge provided a pre-compiled C++ binary, but because I was using a modern LLVM 21 toolchain and the binary was compiled with GCC, I was met with immediate Segmentation Faults. The two were simply incompatible.
Instead of fighting the compiler mismatch and building rules_ros2 with a different compiler, I pivoted. I wrote a custom bridge that takes the display data and sends it over a WebSocket.
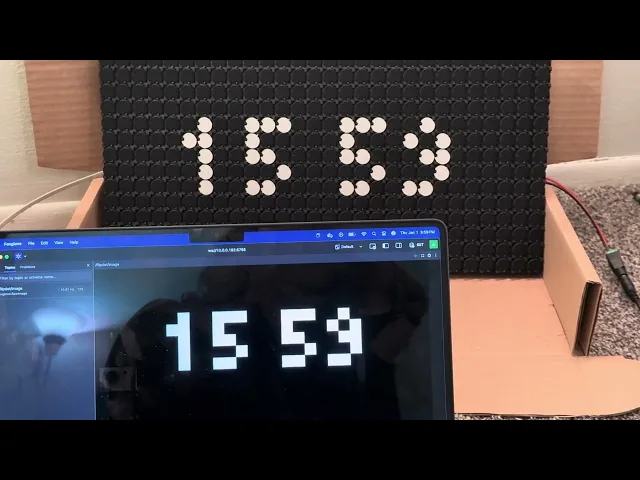
The difference was night and day. Now, I have a "Digital Twin" of my display in Foxglove. It looks exactly like the physical dots, allowing me to iterate on animations, UI layouts, and logic 10x faster than before.
Times New Roman
System Architecture and FSM
Once the display was physically working, I had to decide what to actually show. I wanted the display to be dynamic—switching between a clock, scrolling news, the weather, and custom icons.
To handle this, I implemented a Finite State Machine. It’s a design pattern that allows the system to be in exactly one "mode" at a time. Using an FSM allowed me to define clear triggers — for example, "after 30 seconds of showing the time, switch to the weather state." This made the logic seamless and prevented different display modes from fighting each other for control.
From a system architecture perspective, instead of building one giant, messy program, I split the system into four specialized ROS nodes. This "micro-service" approach made debugging infinitely easier:
The Controller: This is the bridge to the hardware. It listens for
FlipDotFramemessages and translates those bits into physical signals for the flipdot modules.The FSM Publisher: The "Brain." It runs the state machine logic, decides what content needs to be displayed (Time vs. Weather), and publishes the data.
The Visualizer: This node is a "translator." It listens to the same
FlipDotFramemessage as the hardware but converts it into a standard ROS Image message.The Foxglove Bridge: This takes the image from the visualizer and sends it over a websocket. This allowed me to see a live "digital twin" of my display on my laptop using Foxglove Studio without even looking at the physical hardware.
By separating the Visualizer from the Controller, I could develop the FSM and UI on my laptop at a coffee shop without needing the actual 20lb flipdot display sitting next to me. If it looked right in Foxglove, I knew it would look right on the dots.
Text and Icons
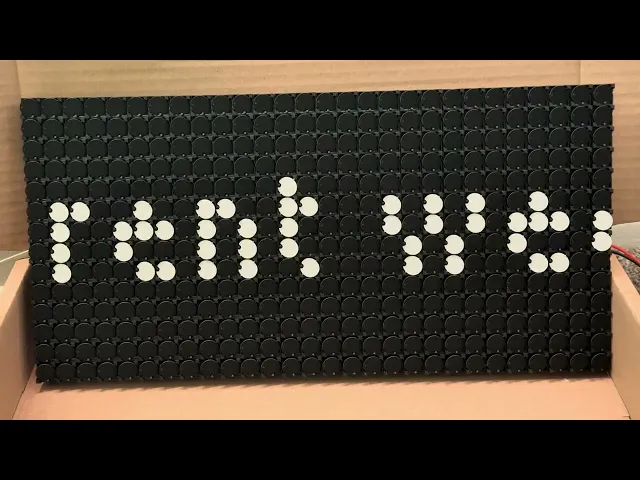
One of the unexpected challenges I faced was actually displaying text and icons on the low resolution display. In a world of 4k high resolution displays, we take for granted anti-aliasing and smooth curves. Most modern fonts are vector based. When they are shrinked down to a small height of lets say 7 pixels, the math breaks and "curves" now become a mess, resulting in illegible text. You cannot flip "half a dot". I had to use a special category of fonts called bitmap fonts (also known as raster fonts). They are designed to occupy a grid, and work well for this use case. The smallest legible font that I could find that was legible on this display was the tiny5 font by google.

tiny5 font

Times New Roman
Unfortunately icons also face the same issue. I couldn't just downscale a high-res PNG of a "Weather" icon, and apparently almost no one makes weather icons for such small displays, it took me some time to find good ones, but at the end of the day I found some that could barely fit my display here.


Icons for different weather
Raspberry PI
Once I had everything running on my dev machine, it was time for the to get stuff running on the Pi.
I wanted a professional workflow. I refused to just "dump" the code onto the Pi and compile it there. The Pi’s processor is slow, and my Bazel-based codebase is complex; waiting for a build on the Pi would have murdered my productivity.
The goal was to build on my powerful dev machine and just move the finished "executables" to the Pi. But here is the problem:
My Dev Machine: x86 architecture (Intel/AMD)
The Raspberry Pi: aarch64 architecture (ARM)
Normally, this requires Cross-Compilation—a notorious headache where you tell your computer to build code for a "brain" it doesn't actually have.
Instead of fighting cross-compilation, I took the shortcut. I switched my Docker environment to aarch64 (emulating the Pi's architecture on my dev machine). This allowed me to:
Compile the code in an environment that "thinks" it's a Pi.
Package the binaries into a
.tarfile.Simply copy that file over to the Pi and run it.
This approach felt good, but It wasn't a win immediately. When I tried to run the code, ROS started complaining—it couldn't find its Shared Libraries (the helper files the code needs to run).
After some deep-dive debugging, I realized the files were there, but the system didn't know where to look. I initially fixed this by overriding some environment variables (like LD_LIBRARY_PATH), but that felt hacky. To fix this I wrote a custom Bazel rule to handle these library paths automatically. Now, the build is "self-aware"—it knows exactly where its dependencies are without me having to manually export variables every time I want to run a test.
Automating Deployment
As the project grew, my "manual" workflow started to fall apart. Every time I made a tiny code change, I had to manually scp (secure copy) files over to the Pi and then manually restart four different programs (controller, foxglove_bridge, visualizer, the fsm_publisher). It was slow, error prone, and frankly annoying.
I needed a way to manage my programs as background services. I turned to systemd, the standard "manager" for Linux systems that handles everything from your display drivers to your networking. Instead of running programs in open terminal windows, I created systemd service files for each component: the controller, the FSM (Finite State Machine), the visualizer, and the Foxglove bridge. To make it even cleaner, I grouped them under a single target.
Now, instead of hunting down four different processes, I can start or stop the entire display with one command:
To fix the scp problem, I wrote a custom Bash script that acts like a lightweight deployment tool. I didn't want to waste time moving massive .tar files if nothing had changed, so I added an MD5 checksum check.
How the script works:
Compare: It checks the MD5 hash of the local file against the one already on the Pi.
Transfer: It only copies the file if the hashes don't match (meaning the code actually changed).
Install: it automatically moves the service files to the correct system directory.
Reload: It restarts the
systemddaemon and triggers the new services.
Now, my "Save and Test" loop is just one command. I run the script, wait a few seconds for the sync, and the flipdots immediately reflect my new code. It turned a 5-minute manual chore into a 10-second automated breeze.
What's next?
Firstly here is the repo containing all the tooling - https://github.com/AdityaSrinivasManohar/flipdot-rpi
Even though I’ve reached a point where the display is mature. I’m already thinking about ways to make it even more over-complicated. Here’s what’s on the roadmap:
More Data Sources: Now that the FSM is solid, it's easy to plug in new states. I’m thinking about adding a GitHub contribution graph and maybe even a Spotify "Now Playing" visualizer.
Web Dashboard: I want to build a simple web interface so I can manually change states, trigger animations, or type out messages to the display from my phone without touching a terminal.
The Enclosure: Right now, it’s a beautiful mess of wires and breakout boards sitting on my desk. I need to design and 3D print (or laser cut) a proper frame that hides the "industrial" look while making those magnetic clicks sound even more satisfying.
This project started as a YouTube rabbit hole and turned into a deep dive into Bazel toolchains, ROS2 message optimization, and aarch64 deployment. It’s been a lot of work, but every time I hear that specific click-clack sound of the dots flipping, I know it was worth it.